INDEPENDENT ASSET MANAGEMENT OVERSIGHT

Your PM Reports Tell You What Each Report Says. We Tell You What They Say Together.

We drive NOI performance and protect downside risk across your portfolio—identifying operational levers and concentration risks your PM company doesn't see. Built for operators, GPs, and fund managers managing up to 4,000 units across one or more markets.

FREE OVERVIEW · NO COMMITMENT

See What Your Reports Say Together

Send us your T-12 + rent roll. We'll identify NOI levers and concentration risks your PM company doesn't see—before you pay anything. Proof of value first.

Every figure traces to source · Every finding carries dollar impact
Built For Operators, GPs, Fund Managers · Up to 4,000 Units

Who It's For

Built for operators, GPs, and fund managers between scales—grown past a single market, not yet at the size where vertical integration makes sense:

Four Ways to Engage

One-Time Diagnostic

SINGLE ENGAGEMENT · FLAT FEE

  • Cross-source read (identify $5-15K in pet rent non-compliance)
  • Lease-up velocity & funnel diagnostic (catch $10-30K in delinquency timing gaps)
  • Marketing & pricing structure audit (find 40-60% wasted ad spend)
  • Ancillary & RUBS capture analysis ($3-8K/year per 100 units typically uncaptured)
  • Exit-readiness note if sale is on horizon

Best when: Need a snapshot without ongoing commitment. Delivered in 7-10 days.

Portfolio Pulse

ONGOING MONITORING

A second set of eyes across the portfolio—monthly/quarterly pulse report + standing flag list of what needs attention. Catches issues 3-6 months before they hit distributions.

  • Occupancy, delinquency, and collections tracking (flag 2%+ variance early)
  • Expiration-cliff watch (prevent $50-150K revenue impact from concentration)
  • Budget-vs-actual variance flagged (identify operational levers behind NOI gap)
  • Trigger flags: escalate to Sprint before it costs you at refinance/listing

Best when: You want continuous read across assets, not a one-time look.

Active NOI Asset Management

FULL FRACTIONAL AM

Extension of your team—not just monitoring, but active execution. A seat at your AM calls driving the NOI plan. Typical impact: $35-85/unit annual NOI improvement through operational tightening.

  • Bi-weekly operational reporting (occupancy, WO, marketing funnel attribution)
  • Monthly analytical reviews (renewal pricing, loss-to-lease capture, turn cost control)
  • Quarterly strategic planning (forward NOI forecast vs plan, variance deep-dives)
  • Budget-vs-actual by NOI line with specific operational levers identified

Best when: Assets need a hand on the wheel. Recent: 6-property portfolio, $72K annual engagement.

Not sure which tier fits your situation?
Schedule a 15-minute call to discuss your portfolio.

Schedule Assessment Call

When to Call Orizon

Day-to-day operational signals that your portfolio needs independent oversight

📊

Approaching Sell/Hold Decision

Loan maturity in 12-18 months—need buyer's-eye read before listing to defend your numbers at closing table

📉

NOI Running Behind Budget

Revenue underperforming or expenses creeping—can't tell if it's PM execution, market shift, or structural

📉

Negative Trade-Outs on Renewals

Renewing residents at lower rents than expiring leases—losing $50-150/unit on every renewal without knowing why

🎯

Leasing Funnel Not Converting

Traffic looks good but applications stall—spending on marketing but can't trace where funnel breaks

📊

Marketing Spend vs Results Unclear

Paying for Google Ads, ILS, and SEO but can't connect spend to leases—need cost-per-lease attribution

🏦

Refinance in Next 6-12 Months

Lender will scrutinize your NOI—need normalized expense schedule and add-back defense ready before appraisal

Case Studies

Real engagements. Actual PowerPoint deliverables. Property names redacted.

3 Case Studies — Click Any Tab to Switch

72-Unit Class C Property · Southeast Alabama Secondary Market

When the PM Funnel Isn't the Problem—Operations Are

Type: Garden-style Built: 1982 Engagement: One-Time Diagnostic

The Challenge

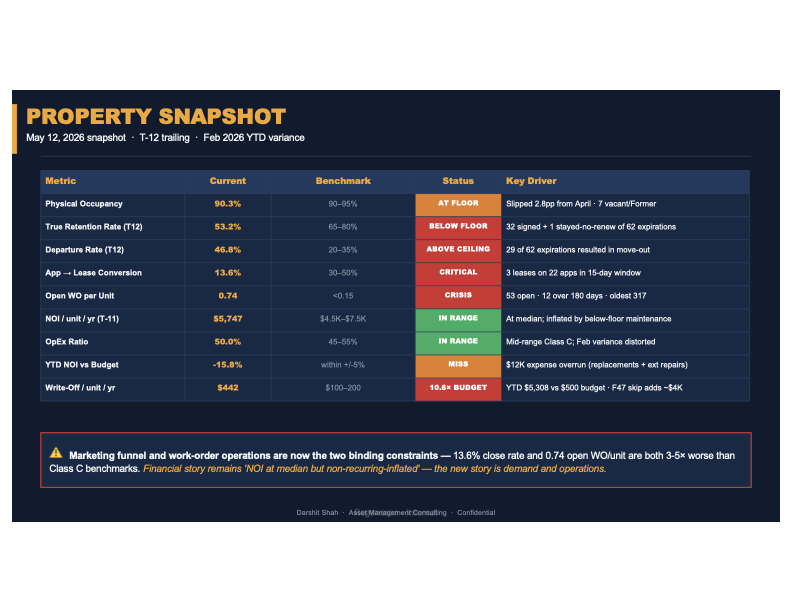
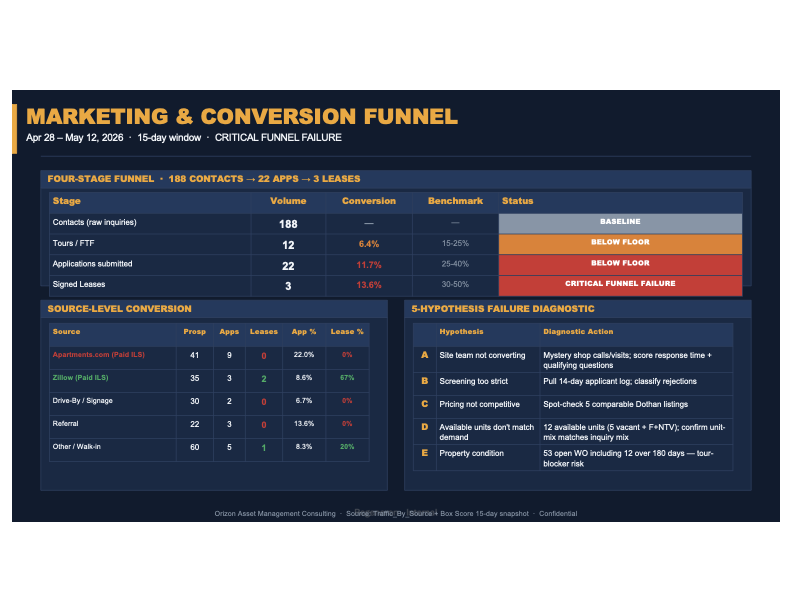
90.3% occupancy looked healthy. Marketing spend was flowing. But applications weren't converting—13.6% close rate vs 30-50% benchmark. Simultaneously, 53 open work orders suggested operational collapse.

What We Found:

  • Funnel breakdown: 188 contacts → 3 leases (13.6%)
  • Apartments.com waste: 41 prospects, 0 leases
  • WO crisis: 0.74/unit (4.9× benchmark)
  • Write-offs: $442/unit vs $100-200 norm
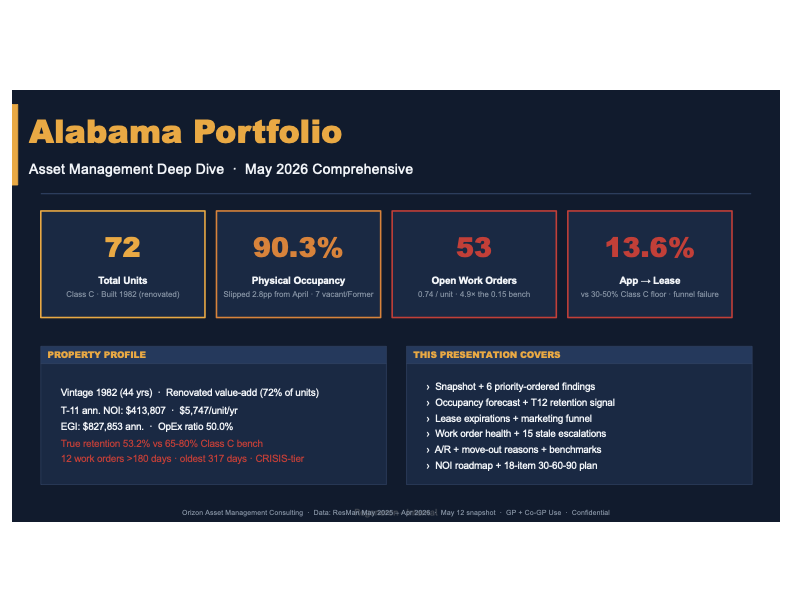
Delivered: 12-slide diagnostic with 18-item action plan, funnel reallocation, WO escalation list.

See if similar operational gaps exist in your portfolio

200-Unit Class C Property · West Houston / Katy Submarket

Loss-to-Lease Widening: When New Signings Trade Down

Type: Garden-style Built: 1984 Engagement: Post-Acquisition AM Audit

The Challenge

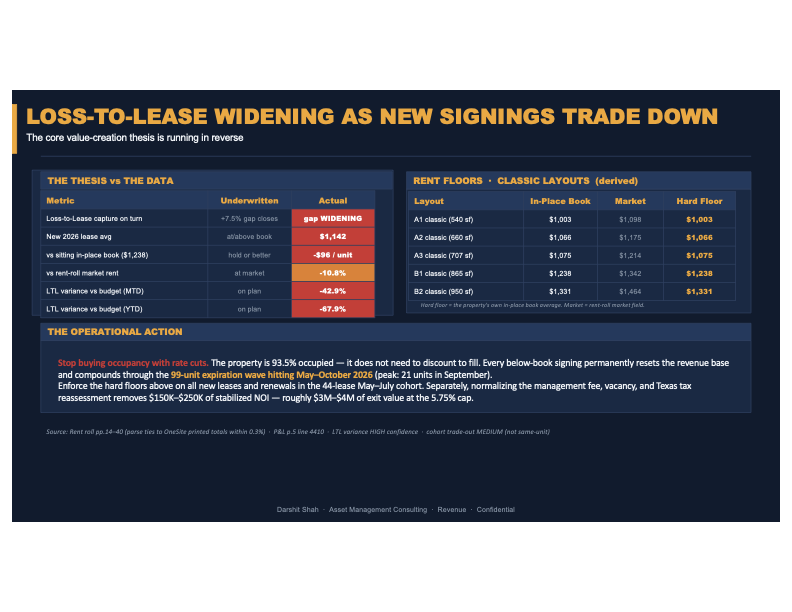
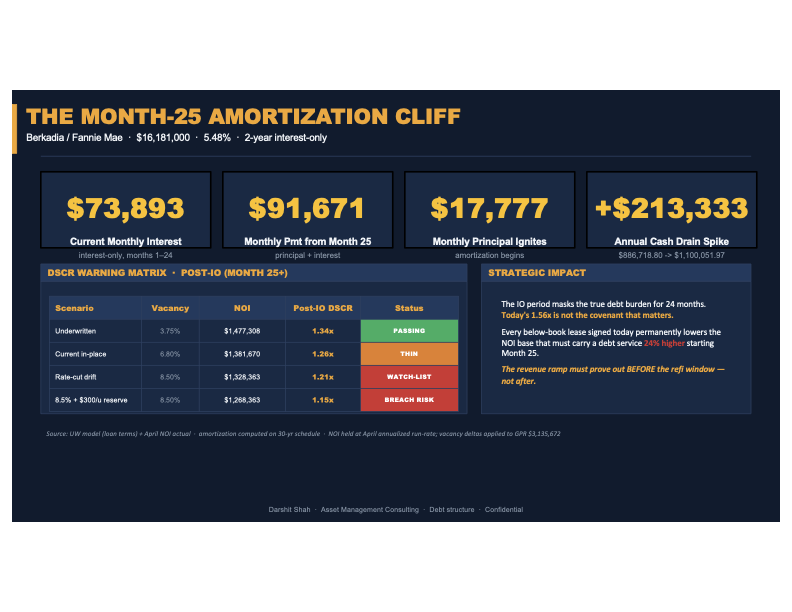
Value-creation thesis running in reverse. New signings trading down below book average to "buy" occupancy. At 93.5%, property didn't need to discount—but every below-book signing reset revenue base permanently.

What We Found:

  • Liquidity crisis: $49,444 cash vs $73,893 monthly debt = zero runway
  • Revenue bleeding: New signings below book average
  • Turn cost masking: $30K CapEx was unit-turn spend
  • Distribution timing: $200K taken while cash dropped
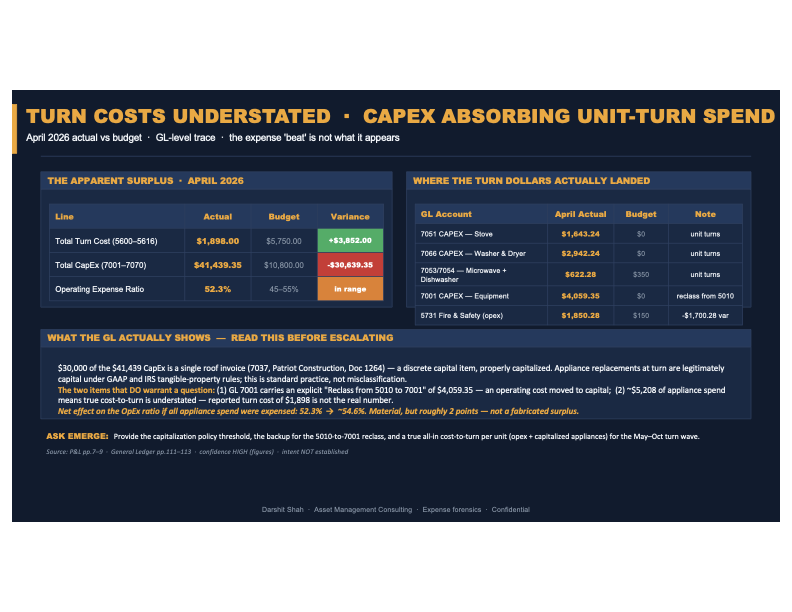
Delivered: Strategic AM Audit with forensic cash timeline, rent floor mandate, distribution freeze recommendation.

Find out if your renewals are bleeding NOI through trade-downs

40-Unit Garden-Style · Kansas City Metro

Sell-Readiness: Don't List on the Dip

Type: Single floorplan Built: 1980s Engagement: Sell-Readiness Sprint

The Challenge

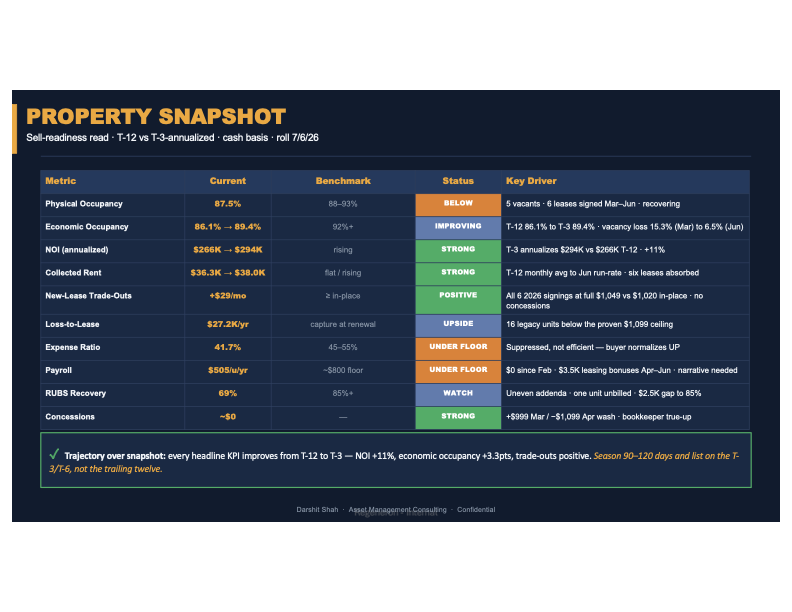
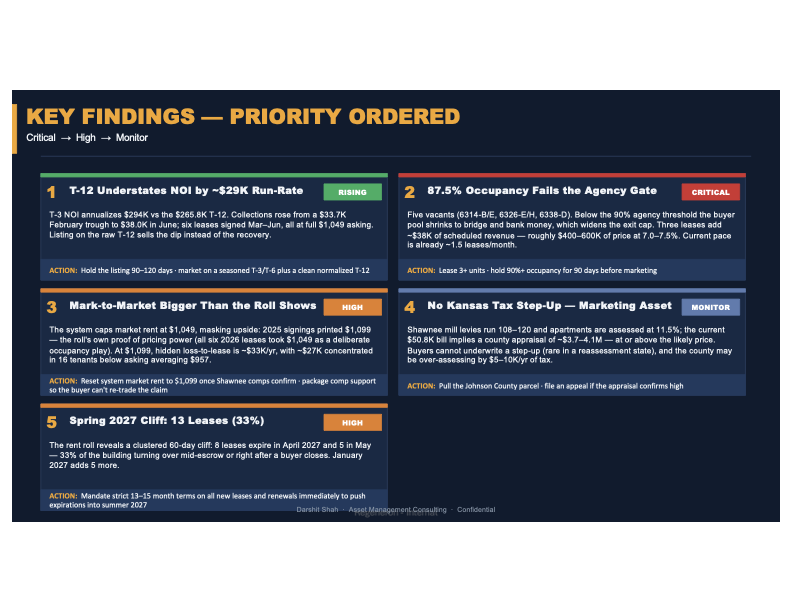
Owner ready to list. T-12 NOI: $265.8K. Problem: T-3 run-rate showed $294K—a $29K gap. Listing on stale T-12 would sell the dip. Plus 87.5% occupancy failed 90% agency gate.

What We Found:

  • T-12 vs T-3 gap: $29K NOI understated
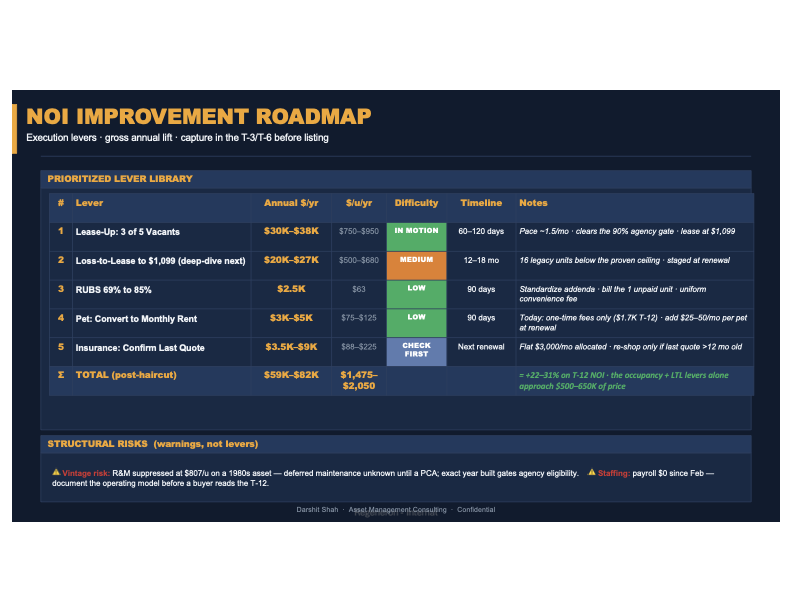
  • Agency gate failure: $400-600K price impact
  • Hidden pricing power: $33K/yr loss-to-lease masked
  • Spring 2027 cliff: 33% of leases expire Apr-May
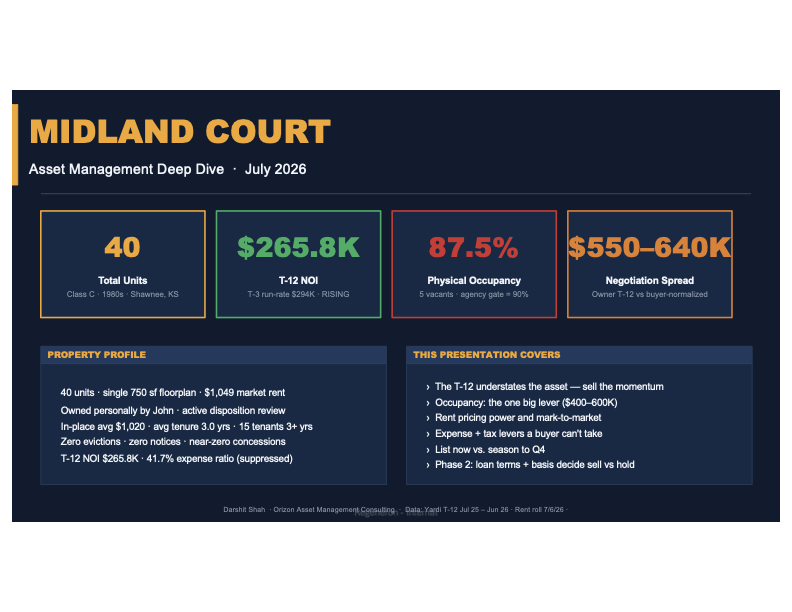
Delivered: 11-slide deck with timing recommendation, occupancy strategy, normalized NOI, lease-term mandate.

Don't leave $400-600K on the table—get sell-readiness reviewed

Request Your Free Overview

Send us your T-12 + rent roll. We'll identify NOI levers and operational risks across your portfolio—proof of value before any commitment.

Prefer to talk first? Skip the form and book a 15-minute call

Book a Call Instead →